Top 11 key metrics to track on Google Analytics 4
Google Analytics is a mess of metrics, dimensions, goals... How can you make sense of it? With the top 11 metrics to track and analyze!

Part of your success on the internet is the ability to measure your top metrics effectively and link them to a larger business goal, with Google Analytics making for the perfect solution to the problem of "visualizing" those goals.
There are 100s of tools to analyze your website and, for the longest time, the "Universal Analytics" (UA) version of Google Analytics was the de-facto choice
However, Google came up with a more advanced version of Google Analytics in October 2020, known as Google Analytics 4.
Since Universal Analytics is being phased out (although still widely used), I'm going to focus on the latest version of their clickstream suite.
The top 11 GA4 metrics you'll need to track regardless of industry are:
1. Users
2. Sessions
3. Average Session Duration
4. Percentage of New Sessions
5. Session by Default Channel Grouping
6. Pages per Session
7. Conversions
8. Total views
9. Views by Page
10. Lifetime Value
11. Lead Generation Cost (Cost per Visit)
This article explains why these metrics are so crucial and how you can use them to further optimize your path towards long-term business success on the internet.
Why these 11 Google Analytics metrics?
The metrics I mention will help your business understand 4 things:
- How customers find your website and how well you retain them
- What action they take after they find out about your website
- Whether your website is growing month-over-month
- Whether you're making a profit or not
Each individual Google Analytics install will be unique to your business and your situation. However, how most metrics work will be the same across installs.
Top GA4 Metric #1: Users
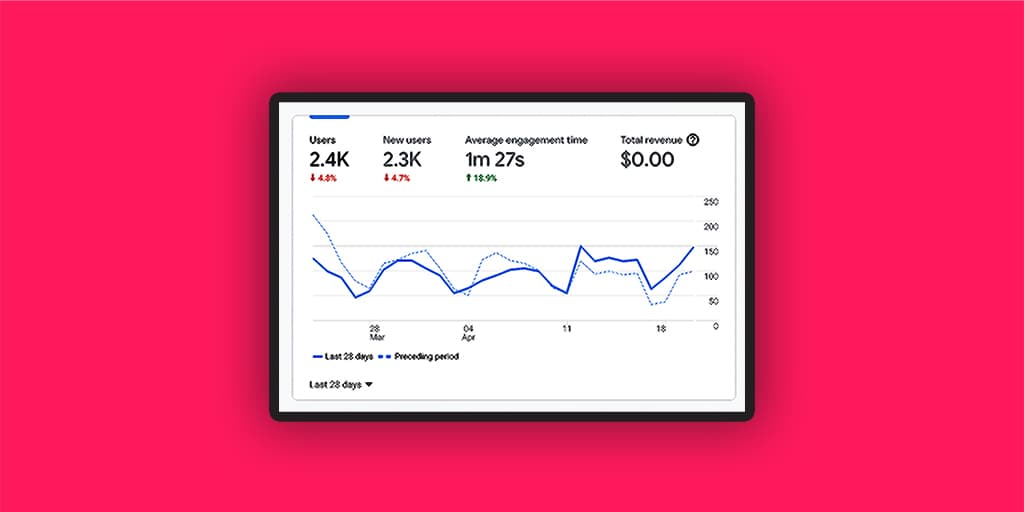
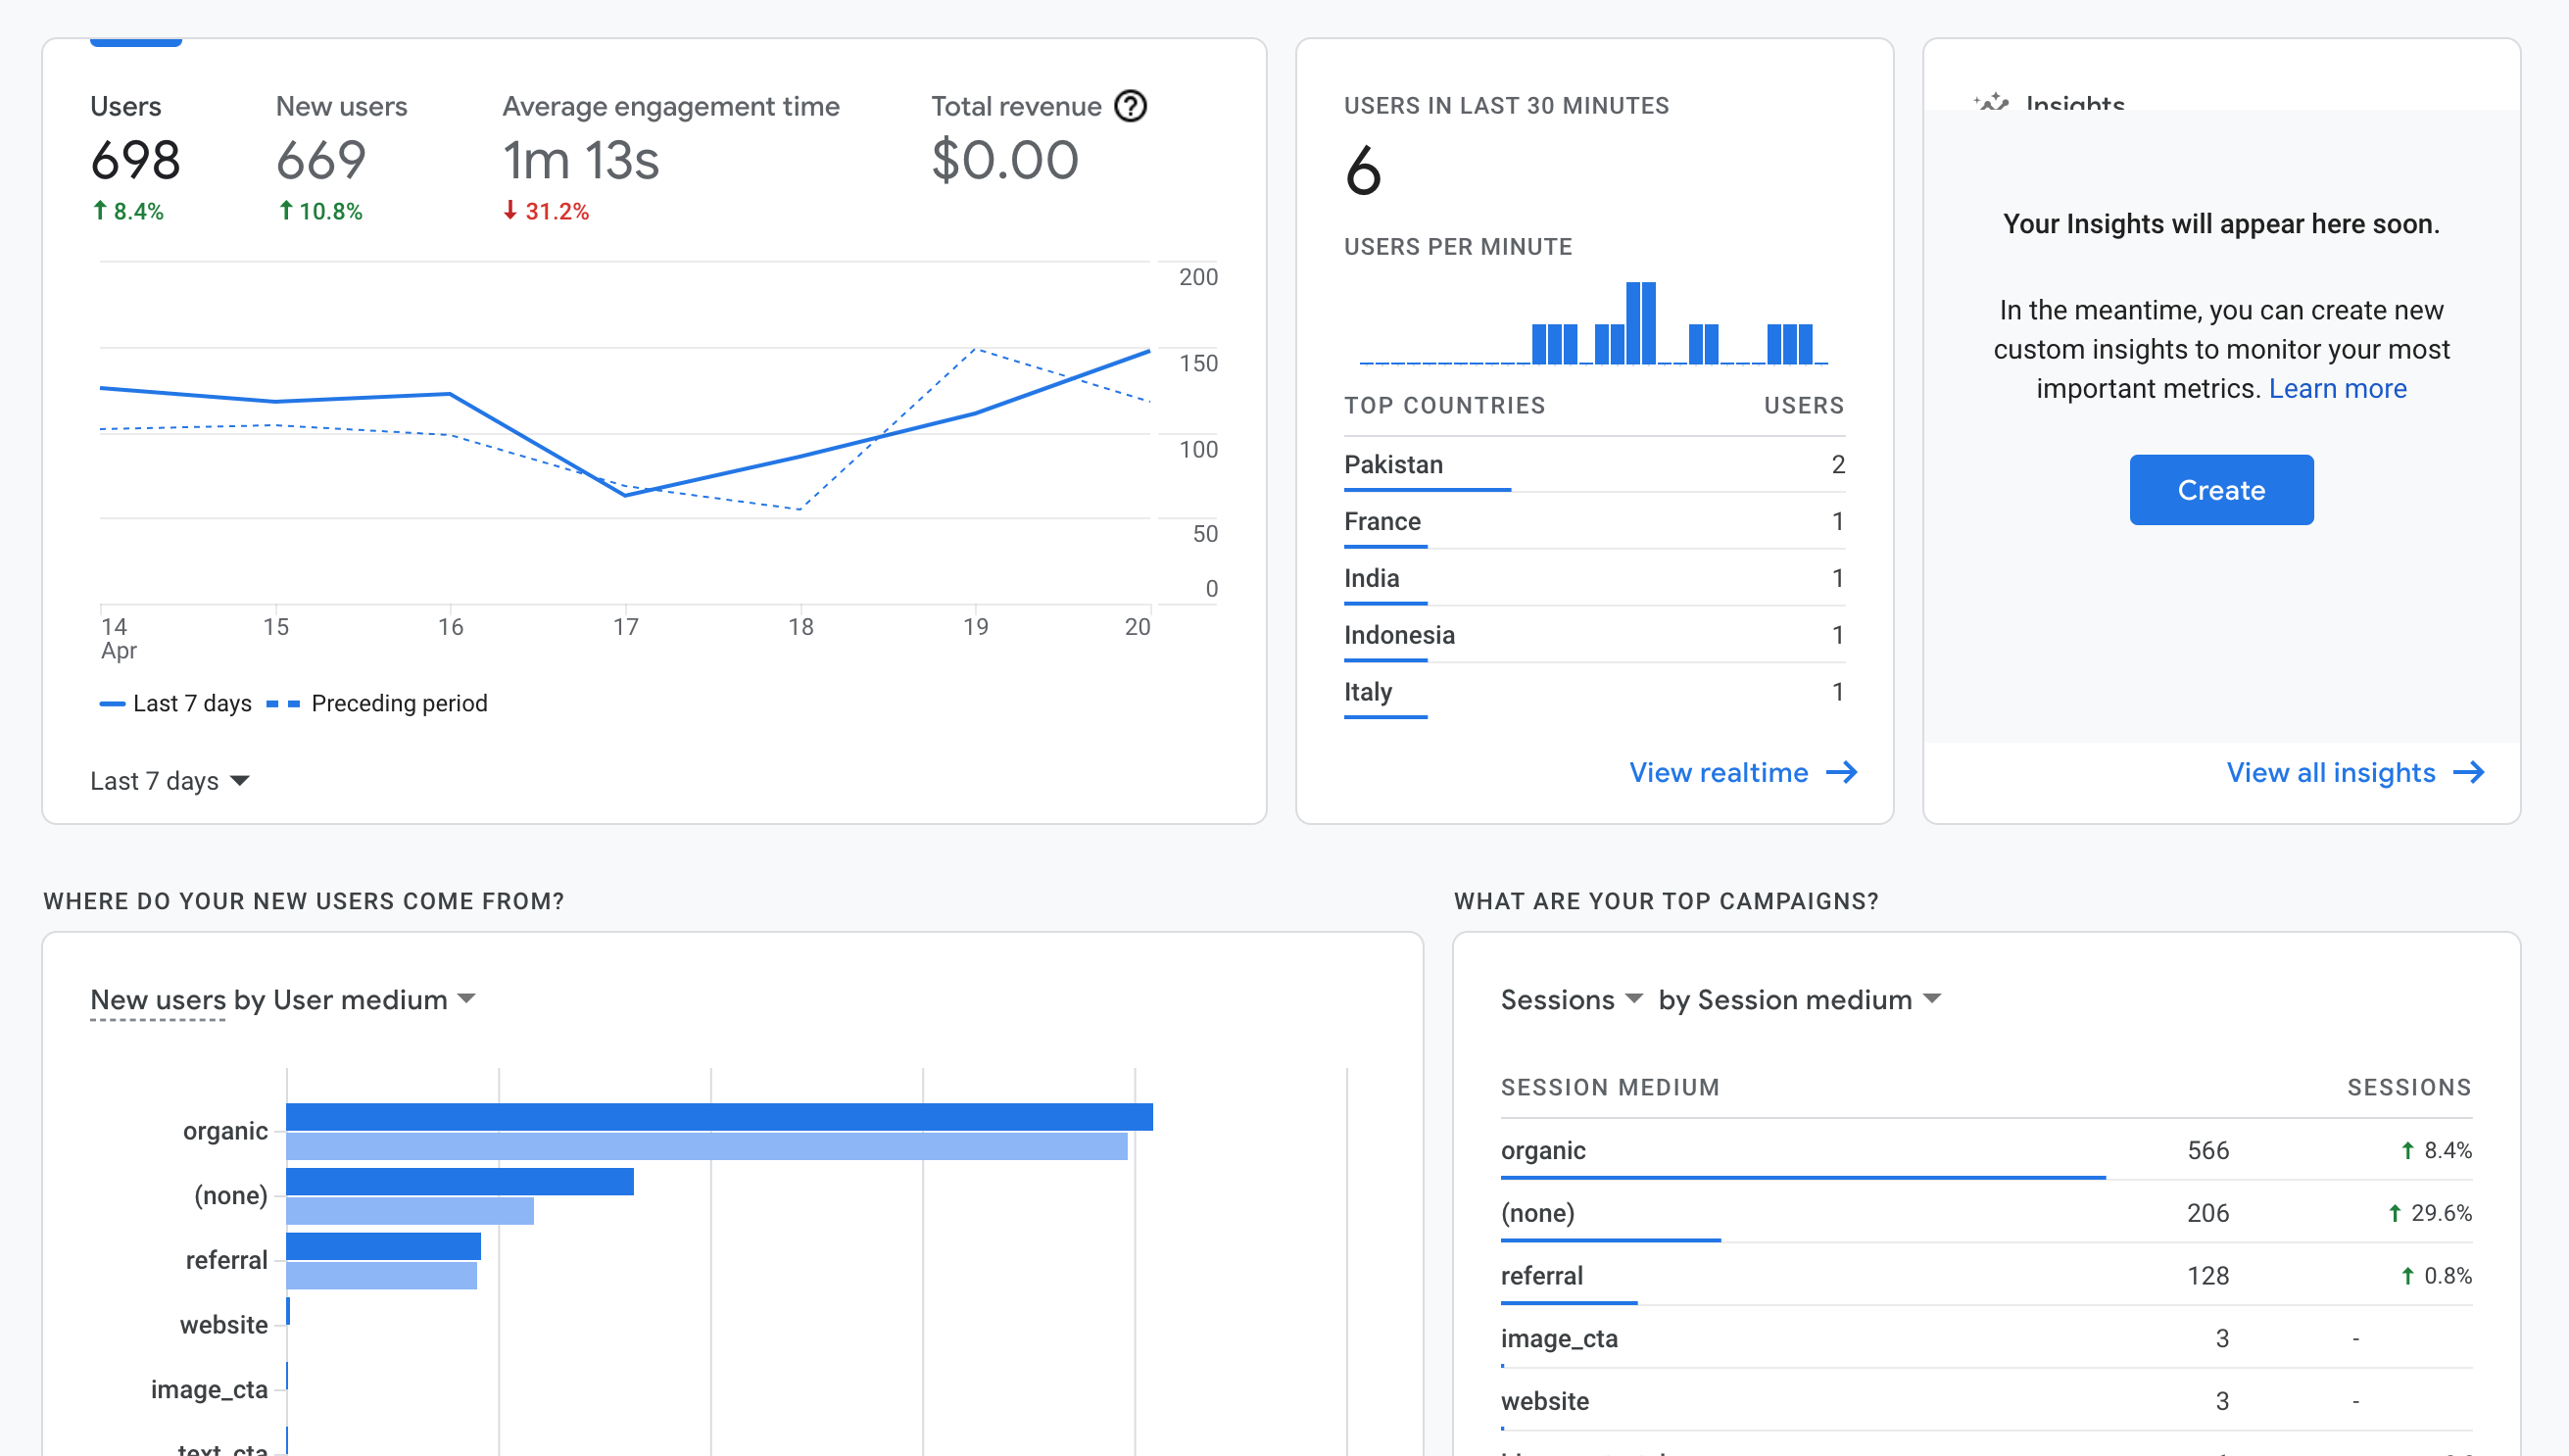
Have you ever wondered how your potential customers behave when interacting with your marketing assets? In GA4, the "Users" metric sits at the core of this.
Google now "tags" each unique customer who visits your website with an ID. So when they are on different devices (mobile, tablet or desktop), it will only count as one unique visitor.
This increases the accuracy of your website performance. It helps you know exactly how many customers return to your website and how many of them are new.
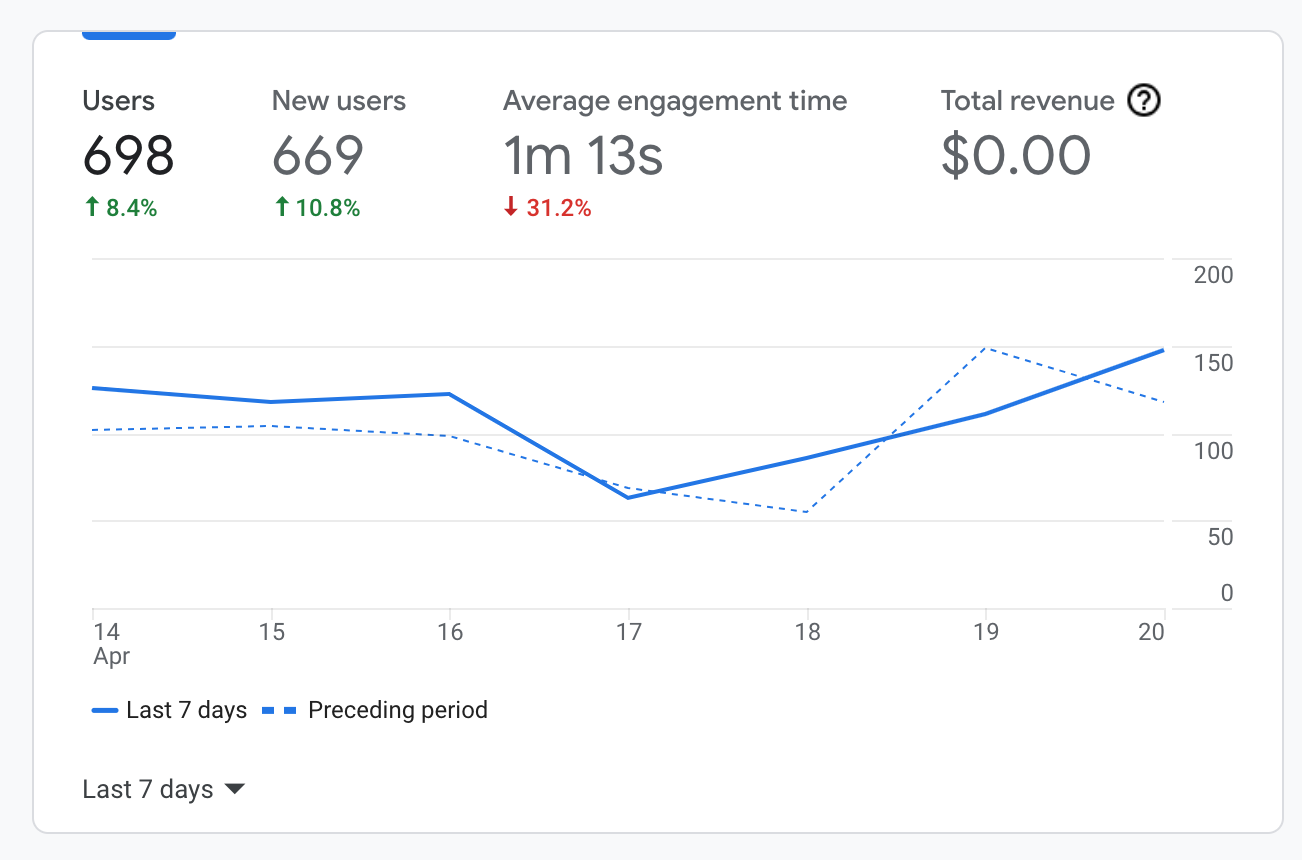
Top GA4 Metric #2: Sessions
“Sessions” refers to the volume of visits to your website.
Each visit counts as 1 session which means if the customer uses a tablet first, and then a phone, 2 sessions will be counted.
This metric is great if you want to keep track of what source provides the most "general" attention to your website.
For example, search engines, social media, guest posts etc. Each session has a time limit that you can choose, with the default being 30 minutes.
Top GA4 Metric #3: Average Engagement Time
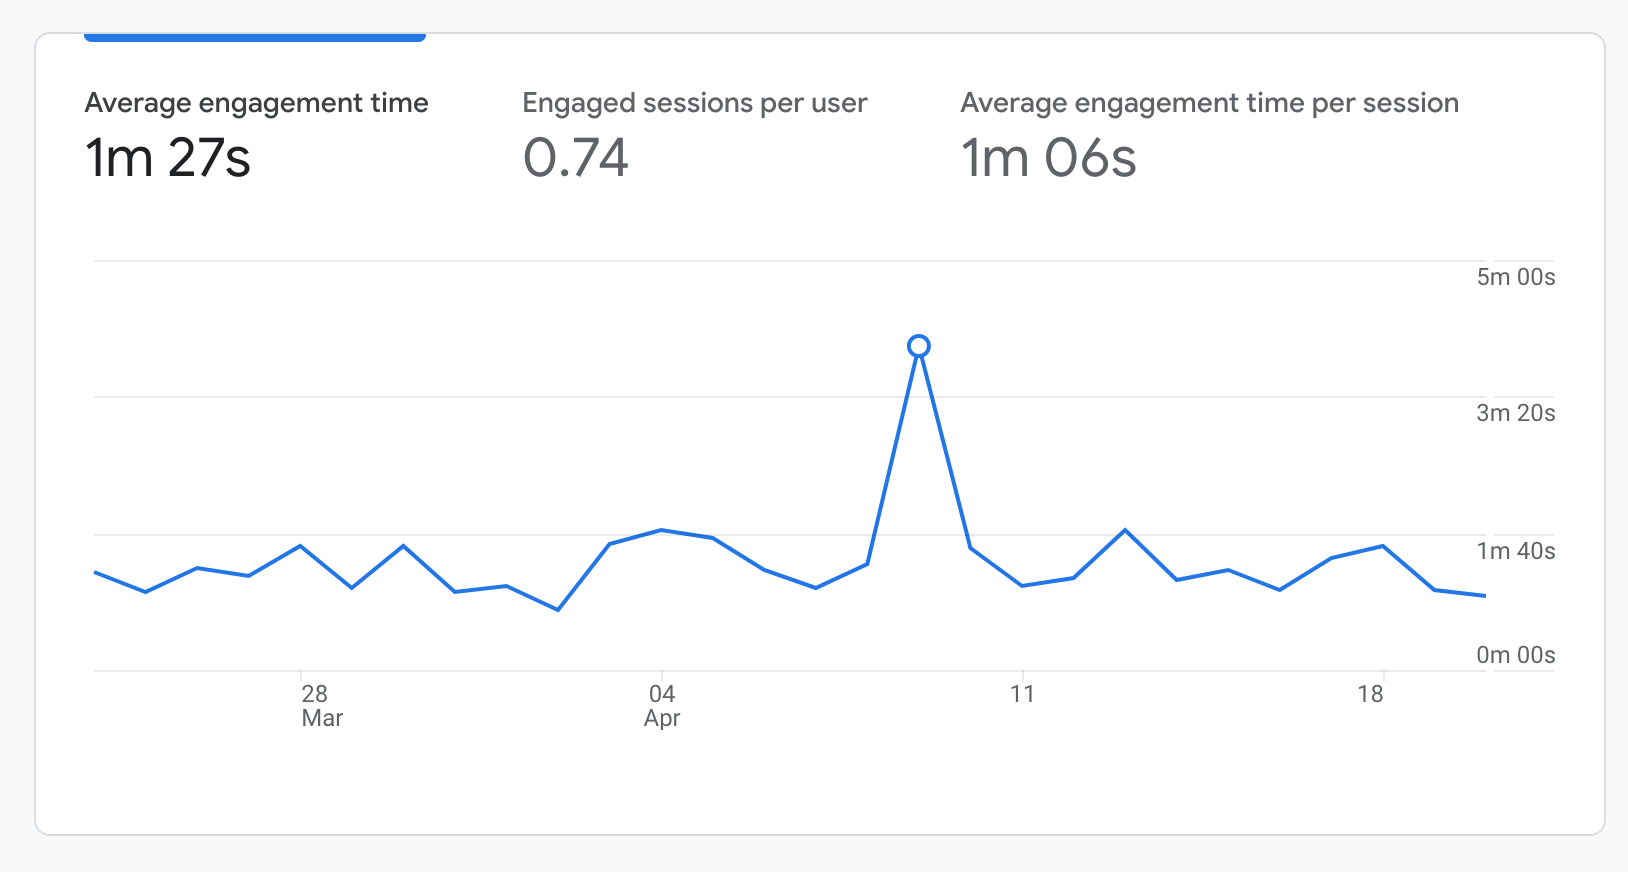
Depending on your customer acquisition strategy, you will have different avg. session times based on where visitors come from. Referrals will stay on your site for longer, for example.
Other sources will prompt potential customers to take action faster rather than waiting too long. You can check this metric for each landing page to see how long prospects stay.
Then, you can optimize the page accordingly.
Otherwise, you might lose profit.
If you have a blog, the longer the readers stay on your site, the more money you can ask from advertisers. The more an audience is engaged with your content, the more value you get.
Top GA4 Metric #4: Percentage of New Sessions
A lot of businesses track this metric to know the rate of new visitors vs return visitors.The reason behind it is for them to retain their audience.
If you have so many new visitors and no one comes back to your site, there's something wrong in your setup.
By analyzing this metric, you can gauge whether your website needs more features to keep potential customers coming back for more.
Updating your content also helps by prompting Google to boost you up in search rankings as long as you're providing value.
Top GA4 Metric #5: Session by Default Channel Grouping
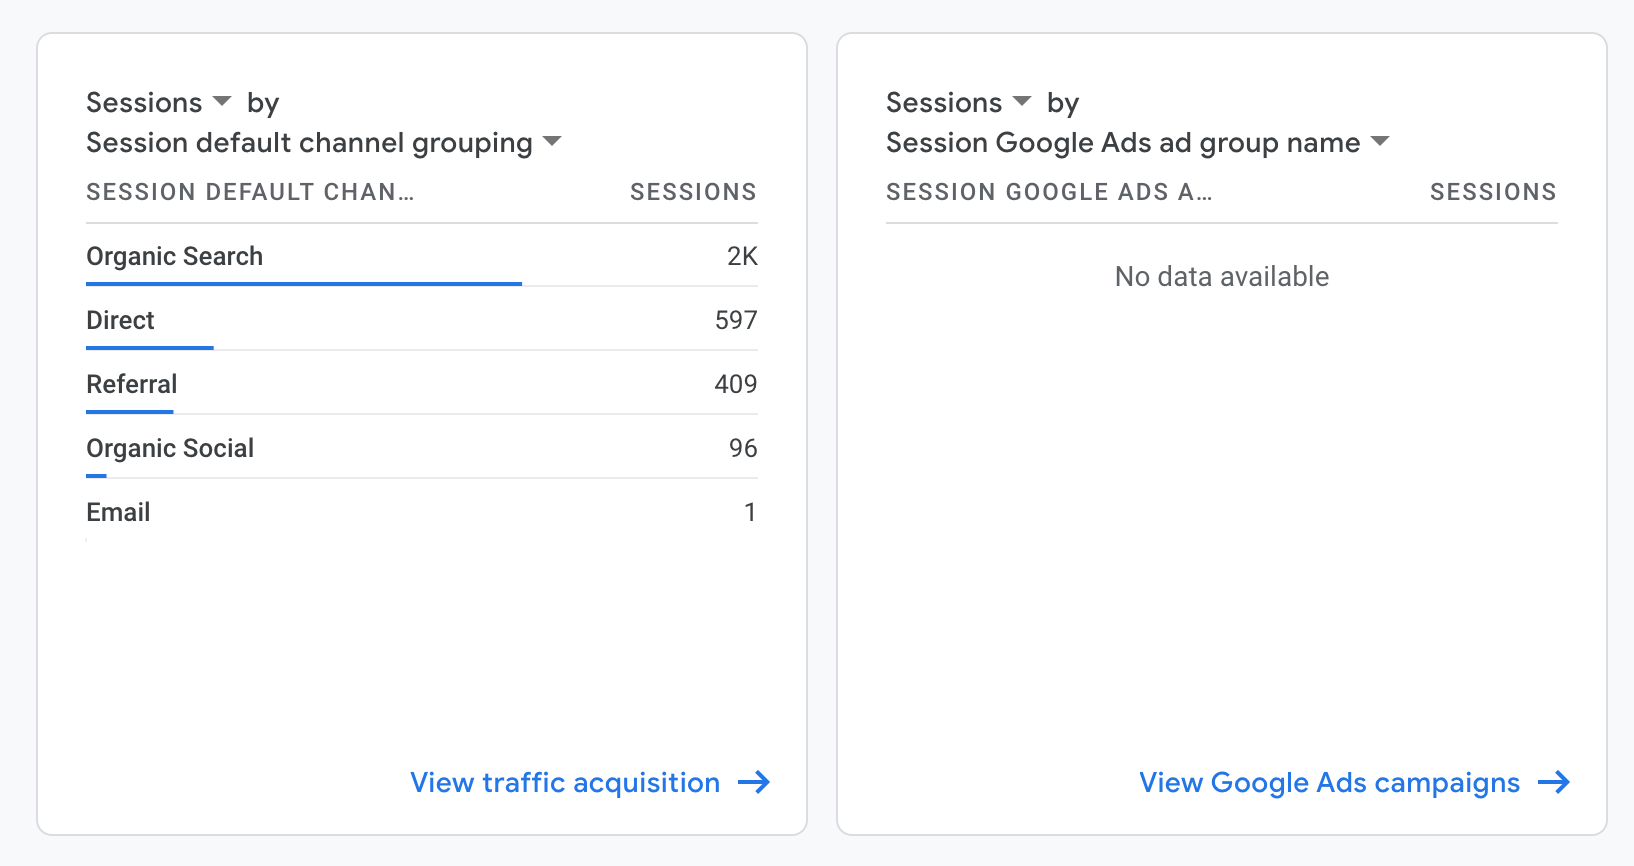
Each channel that contains your website can lead the customer to your business.
From a social post to a promotional ad, customers can find you through a third-party channel and visit your website. The tricky part is you should know where customers came from to use that data to grow faster.
This metric will tell you exactly where prospects come from.
Make sure you assign the source link with UTM tracking so you know all the details of where they come from.
Top GA4 Metric #6: Pages per Session
If you have many pages on your website, it’s good to keep track of this metric because it calculates how many pages a reader sees per session (in 30 mins limit).
Google calculates this by dividing the number of page views by the total session.
This metric is not 100% accurate since the same customer can log in to the same pages 5 times and still have the same result as them logging in 5 unique pages.
However, it is suitable as a measurement of engagement on your website. If this metric is low, you can add more navigation or call-to-actions to guide customers to a different page.
Top GA4 Metric #7: Conversions
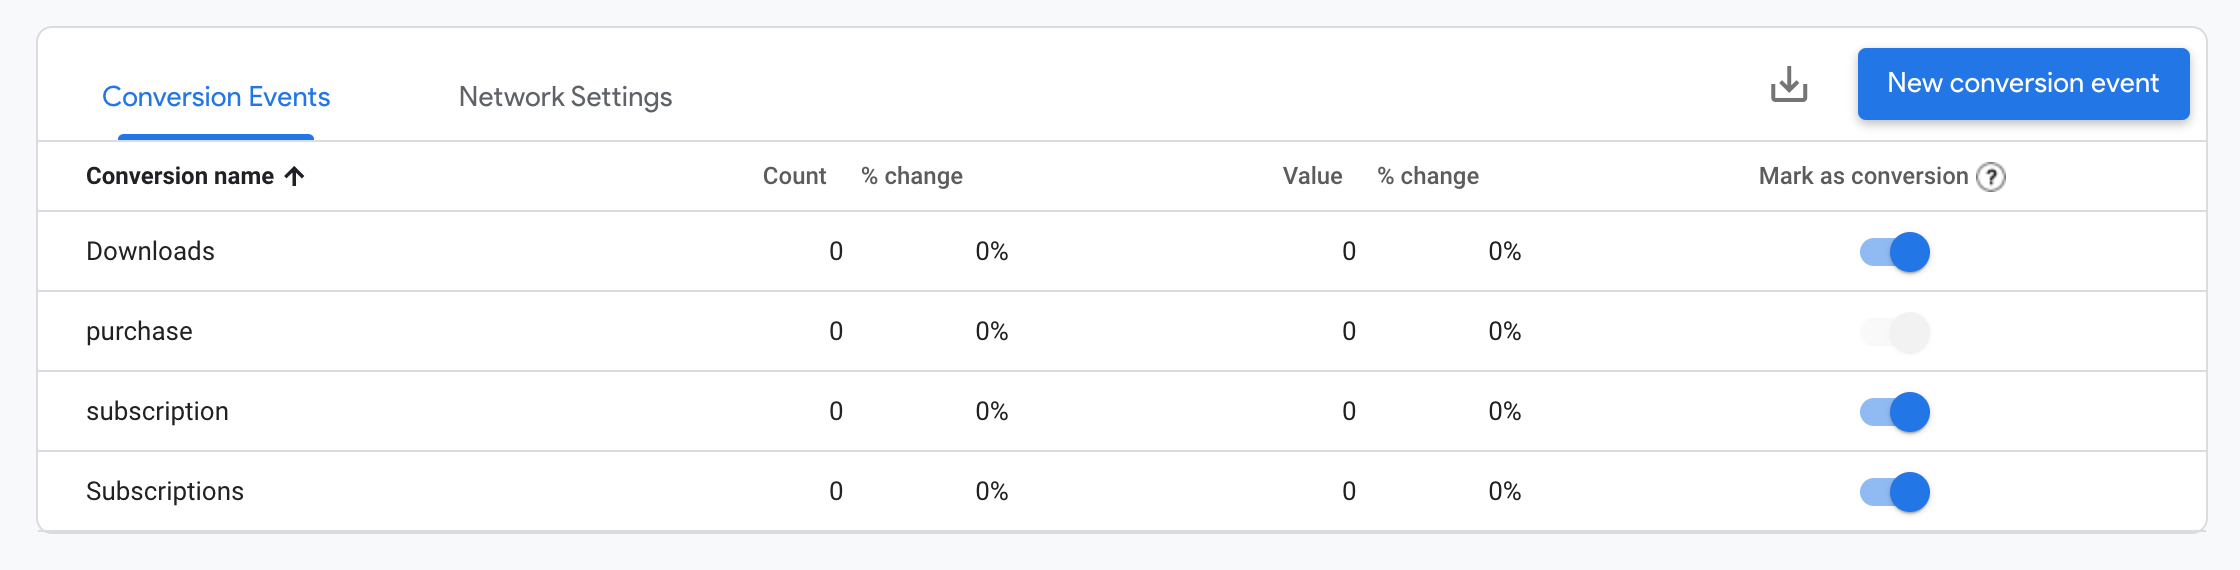
Although it's placed at number #8 in this list due to how long it can take to set up properly, conversions are perhaps the most important metric on Google Analytics 4.
Previously known as goals, an easy way to trigger a conversion is to link the thank you page (the last page customer sees after finishing an action) as a goal completion. That's the typical way it's handled.
Every business needs a specific goal to track their marketing performance. If you have an online store, your goal should be to have people place items in the cart and click on "Purchase." Setting up conversions in GA4 is what helps you see that.
Top GA4 Metric #8: Total Views
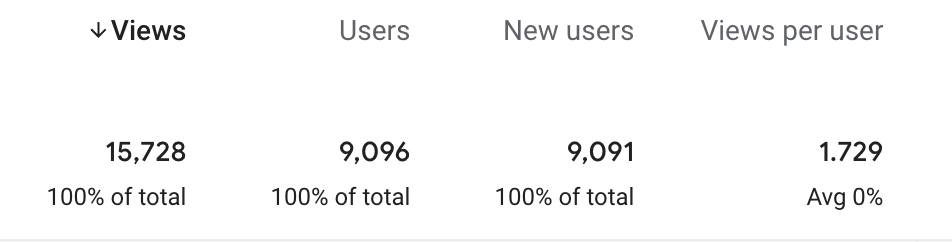
This metric is very straightforward.
It keeps track of how many times your website got views in total. The only downside of this metric is it cannot keep track of any unique view.
This means if one customer logs in and out of your website 30 times, it'll show 30 additional views. Just like a view count on YouTube, this is more of a vanity metric than anything. But it still helps to know that your site reached a certain view level within a set timeframe like, say, a quarter or an entire year even.
Top GA4 Metric #9: Views by Page
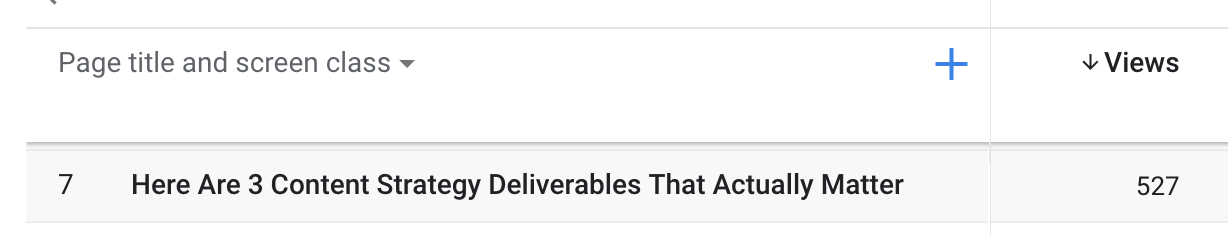
This metric shows you views on each specific page on your website.
This metric helps you know exactly which page has more views than others and It'll help you understand which piece of content the prospect wants to see.
For example, you have a website about finance, and most of the views count is about stocks, this potentially means that your readers would appreciate more content on stocks from you.
The views by page is also a good gauge to understand where sudden spikes of traffic came from as you can compare week-over-week performance of each individual page.
Top GA4 Metric #10: Lifetime Value
This metric measures the lifetime value of each customer that visits your website. Depending on what you sell and each customer’s life cycle, you can collect this data on Google Analytics.
This data will help you find a reasonable estimate of how much money you can spend to get a new customer. The lifetime value of each customer increases if you shorten the current buying cycle.
Top GA4 Metric #11: Lead Generation Cost (Cost per Visit)
If you do any advertising with Google Ads, you know this one is the top metric to track. Lead generation cost is the amount of money you need to acquire a lead from Google Ads. You can see this metric appear on Google Analytics only if you have a Google Ads campaign running.
No matter which metric you choose to track via Google Analytics, having a landing page that converts visitors into leads and eventually customers is paramount.
Analyzing website performance isn't just about bragging rights, it's about making sure that people who visit take specific, favorable actions for the development of your business.
Originally published 22 Apr 2021